Probability distributions are mathematical functions that describe the likelihood of different outcomes for a random variable. They provide a complete description of the probability structure of random phenomena and are fundamental to statistical analysis and machine learning.
Overview
Probability distributions can be classified based on the nature of the random variable: discrete (countable outcomes), continuous (uncountable outcomes within intervals), or mixed (combinations). Each distribution is characterized by its support (possible values), probability function (PMF for discrete, PDF for continuous), cumulative distribution function, parameters, and moments.
DefinitionProbability Distribution
A probability distribution is a function or rule that assigns probabilities to the outcomes of a random experiment or, more generally, to the events in a sample space.
Let X be a random variable, then the probability distribution of X is defined by its probability mass function (PMF) for discrete variables or probability density function (PDF) for continuous variables.
Without loss of generality, we can define the distribution of a random variable X as follows:
P(X=x)=f(x)
for discrete variables, where f(x) is the PMF, and
P(X≤x)=F(x)
for continuous variables, where F(x) is the cumulative distribution function (CDF).
The PMF and PDF must satisfy the properties of non-negativity and normalization:
For discrete variables: ∑xP(X=x)=1
For continuous variables: ∫−∞∞f(x)dx=1
Discrete Probability Distributions
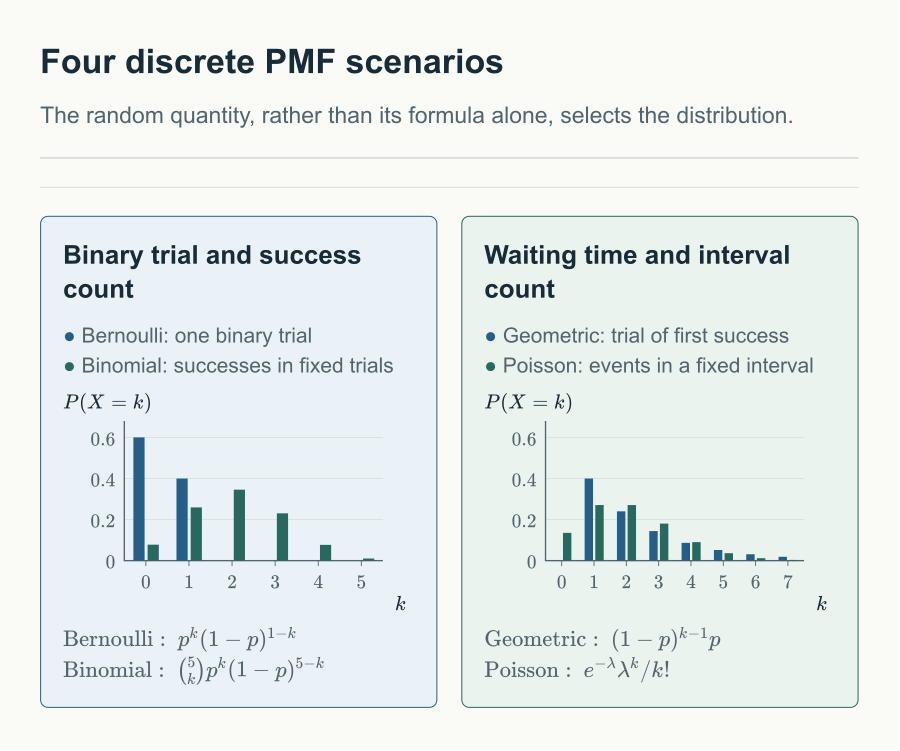
The quantity being counted separates Bernoulli, binomial, geometric, and Poisson models; the plotted parameters are illustrative.
Bernoulli Distribution
Models a single trial with two possible outcomes (success/failure)
Parameters: p (probability of success), where 0≤p≤1
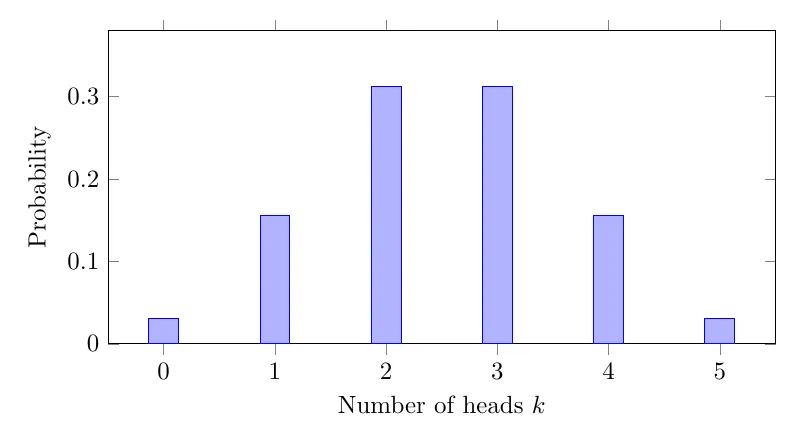
The source chapter plots a binomial example with n=5 fair coin tosses. The probabilities of 0 through 5 heads are 321,325,3210,3210,325,321.
Hypergeometric Distribution
The name looks related to the geometric distribution, but it is not. It is named after the hypergeometric function that appears in the PMF. Unlike Bernoulli-type families, a hypergeometric random variable models draws without replacement, so successive draws are dependent.
DefinitionHypergeometric distribution
The hypergeometric distribution is the law of the number of successes k in n draws from a finite population of size N that contains K successes. Its PMF is
Combinatorially: choose k successes from K, choose n−k failures from N−K, and divide by the number of ways to choose n items from N.
ExampleDrawing red balls without replacement
A population of 20 balls has 8 red and 12 blue. Draw 5 balls without replacement. Let X be the number of red balls drawn. Then X is hypergeometric with N=20, K=8, n=5, and
TheoremMean and variance of a hypergeometric random variable
If X is hypergeometric with integer parameters N>1, 0≤K≤N, and 0≤n≤N, then
E[X]=nNK,Var(X)=nNK(1−NK)N−1N−n.
Proof
Write X=∑i=1nIi, where Ii is 1 if the i-th draw is a success. Each Ii has mean K/N, so linearity gives E[X]=nK/N.
For the second moment, E[X(X−1)]=n(n−1)N(N−1)K(K−1), hence
E[X2]=n(n−1)N(N−1)K(K−1)+nNK.
Subtracting (E[X])2 and rearranging yields the variance formula.
Let p=K/N. Then Var(X)=np(1−p)N−1N−n. When N is large relative to n, the extra factor is near 1, and the variance is close to the binomial variance np(1−p).
Applications: Sampling without replacement, quality control, ecological studies
Poisson Distribution
Models the number of events occurring in a fixed interval
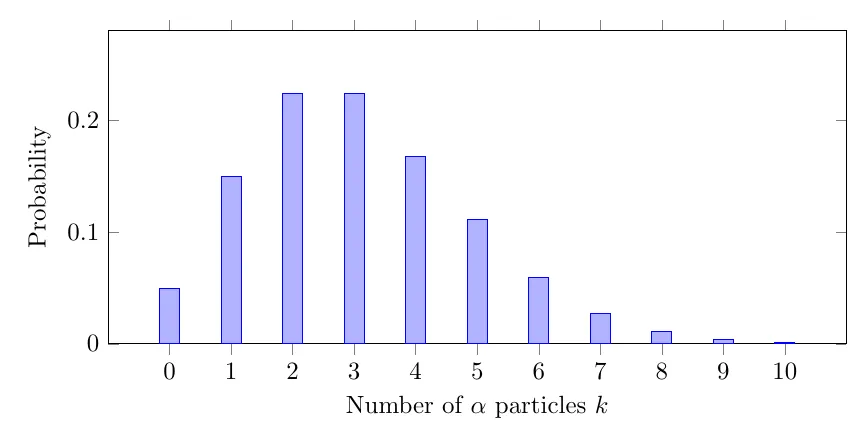
The three factors after λk/k! tend to 1,e−λ,1, respectively. This proves convergence of each point probability to the Poisson PMF; summing finitely many points gives convergence of the CDF at each finite noninteger argument.
Geometric Distribution
The geometric distribution is the waiting time until the first success in independent Bernoulli trials with success probability p.
DefinitionGeometric distribution
If Y is the number of trials up to and including the first success, then Y follows a geometric distribution with parameter p. Its probability mass function is
P(Y=k)=(1−p)k−1p,k=1,2,3,…
The sequence is fixed: k−1 failures followed by one success, so there is no binomial coefficient. The probabilities form a geometric sequence with first term p and ratio 1−p, and they sum to 1:
n=1∑∞P{X=n}=pn=1∑∞(1−p)n−1=1−(1−p)p=1.
ExampleFirst successful free throw
A basketball player makes a free throw with probability p=0.3. What is the probability that the first success occurs on the 4th attempt?
Solution
Let X be the attempt of the first success. Then
P(X=4)=(0.7)3⋅0.3=0.1029.
TheoremMean and variance of a geometric random variable
If X is geometric with parameter p, then
E[X]=p1,Var(X)=p21−p.
Proof
For 0<p<1, put q=1−p. The sums of kqk−1 and k2qk−1 converge by the ratio test, so the following expectations are finite and can be rearranged. Condition on the first trial. On failure, X=1+X′ where X′ has the same geometric distribution. With m=E[X] and s=E[X2],
m=p+q(1+m)=1+qm,
so m=1/p. Similarly,
s=p+q(1+2m+s)=1+2qm+qs.
Thus s=(1+2q/p)/p=(2−p)/p2, and Var(X)=s−m2=(1−p)/p2. If p=1, X=1 almost surely and the same formulas hold. The case p=0 has no finite waiting time and is excluded.
Other Discrete Distributions
Section Pending Migration / Draft Placeholder
The source chapter lists several additional discrete distribution families as outline placeholders: Discrete Uniform, Negative Binomial, Zeta-Bernoulli, Logarithmic Series, and Zipf distributions. Full definitions, PMF formulations, and moment calculations will be authored in a future update.
Continuous Probability Distributions
Normal (Gaussian) Distribution
The most important continuous distribution in statistics
Parameters: μ (mean), σ2 (variance)
Support: x∈(−∞,∞)
PDF: f(x)=σ2π1e−2σ2(x−μ)2
Moment Calculations:
For the standard normal distribution Z∼N(0,1):
The expected value is:
E[Z]=∫−∞∞z⋅2π1e−z2/2dz=0
This follows because the integrand is an odd function and the integral converges.
For the variance:
E[Z2]=∫−∞∞z2⋅2π1e−z2/2dz
Using integration by parts with u=z, dv=ze−z2/2dz:
Conditions: Linear combinations of mutually independent normal variables are normal, as follows by iterating the proof below and using affine transformations. Marginal normality alone is insufficient. The i.i.d. central limit theorem concerns centered sums divided by σn, with finite positive variance; its general proof belongs to the planned limit-theory chapter.
Additivity Property: If X∼N(μ1,σ12) and Y∼N(μ2,σ22) are independent, then:
X+Y∼N(μ1+μ2,σ12+σ22)
ProofAdditivity
Independence gives the convolution density fX+Y(z)=∫fX(x)fY(z−x)dx. This follows by integrating the joint density over x+y≤z and differentiating in z. Put v=σ12+σ22 and
Integer-shape case: For a positive integer α, this is the sum of α independent Exponential(β) variables. Noninteger shapes are not a count of summands.
For completeness define Γ(a)=∫0∞ua−1e−udu for a>0. Integration by parts gives Γ(a+1)=aΓ(a) and Γ(1)=1, hence Γ(k)=(k−1)! for positive integers. Substitution u=βx proves that the gamma density integrates to one (its displayed formula is for x>0; the value at zero does not affect the law).
The integer-shape sum property follows by convolution and induction. If the sum of k exponential variables has density βkxk−1e−βx/(k−1)!, convolving with one more exponential gives
∫0x(k−1)!βkuk−1e−βuβe−β(x−u)du=k!βk+1xke−βx.
The base case is the exponential density itself.
Logistic Distribution(optional)
Models growth curves and binary choice models
Parameters: μ (location), s (scale), where s>0
Support: x∈(−∞,∞)
PDF: f(x)=s(1+e−(x−μ)/s)2e−(x−μ)/s
Moment Calculations:
The cumulative distribution function is:
F(x)=1+e−(x−μ)/s1
For the standard logistic distribution where μ=0 and s=1:
Using the substitution u=1+e−x1, which gives x=ln(1−uu) and dx=u(1−u)du:
E[X2]=∫01[ln(1−uu)]2du
ProofEvaluating the logistic second moment
For x≥0, the standard logistic density is at most e−x, so the first two absolute moments are finite and the symmetry argument is justified. Integration by parts gives ∫01log2udu=2. Expanding −log(1−u)=∑n≥1un/n and applying monotone convergence to the nonnegative summands gives
Here ∫01(−logu)undu=1/(n+1)2 follows by integration by parts. Expanding the square of logu−log(1−u) therefore yields
∫01log21−uudu=2n≥1∑n21=3π2.
The last equality uses the Basel identity ∑n−2=π2/6, whose proof is not yet established in this collection. The reduction to that identity is complete; its numerical evaluation remains an explicit analysis dependency.
For the general logistic distribution X=μ+sZ where Z∼Logistic(0,1):
E[X]=μ+sE[Z]=μV(X)=s2V(Z)=3s2π2
Gumbel difference. Let G1,G2 be independent Gumbel variables with the same location μ and scale s>0, with CDF exp(−e−(x−μ)/s). Set Ei=e−(Gi−μ)/s. Direct substitution gives P(Ei>t)=e−t for t>0, so they are independent rate-one exponential variables. Thus
Let X∼Binomial(n,p). Using the representation of X as a sum of independent and identically distributed Bernoulli random variables, derive the formulas for the expected value E[X] and the variance V(X).
Solution
Represent the binomial random variable X as the sum of n independent indicator random variables:
Base Case:
The base case is the probability of zero successes:
P(X=0)=(1−p)n.
Algorithmic Advantage:
Direct calculation of (kn)=k!(n−k)!n! requires computing huge factorials, which rapidly cause numerical floating-point overflow for moderate values of n (such as n>170 in standard 64-bit IEEE 754 float). The recurrence relation computes each subsequent probability P(X=k+1) from P(X=k) in O(1) multiplications without ever forming factorials, achieving O(n) time complexity. This avoids factorial overflow but does not guarantee numerical stability: the starting value (1−p)n can underflow, and rounding errors can accumulate. The ratio derivation assumes 0<p<1; handle p=0,1 as point masses.
Comments