A compact note on expected value, variance, standard deviation, LOTUS, linearity, and the basic proof patterns used throughout probability theory.
MathematicsProbability TheoryExpectationVariance
On this page
Expectation and Variance
Expectation and variance are two fundamental concepts in probability theory that describe the central tendency and spread of a random variable's distribution.
Throughout, identities between finite expectations assume integrability: E∣X∣<∞, and variance/covariance formulas assume finite second moments. A nonnegative expectation may be +∞, but subtraction of infinities is not allowed. The continuous formulas below use measurable functions and the usual integral rules.
Expected Value (Mean)
The expected value, also known as the mean or expectation, represents the average value of a random variable over many trials.
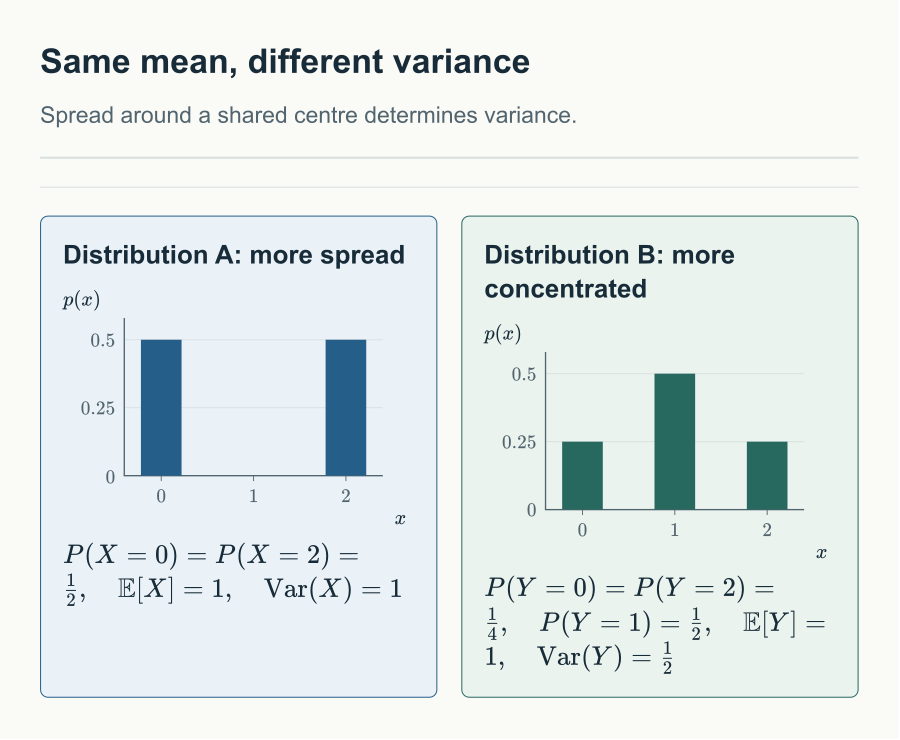
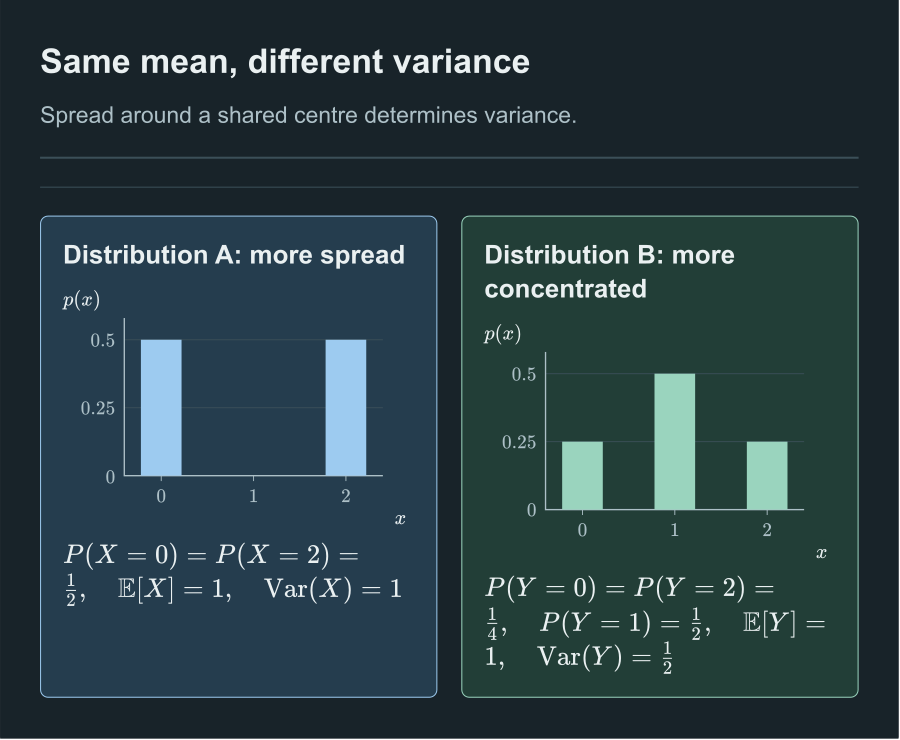
Put μ=E[X]. Expansion and linearity give E[(X−μ)2]=E[X2]−2μE[X]+μ2=E[X2]−μ2. Nonnegativity follows from the squared integrand. A constant has zero centered square. Conversely, if the expectation of that square is zero, each event {∣X−μ∣≥1/k} has probability zero by the pointwise lower bound (X−μ)2≥k−2 on the event. Their countable union is {X=μ}, so zero variance means X=μ almost surely.
When we apply a function to a random variable, we obtain a new random variable. Computing the expectation of this new random variable is a fundamental problem in probability theory.
Law of the Unconscious Statistician (LOTUS)
The core principle for computing expectations of functions of random variables is the Law of the Unconscious Statistician (LOTUS). This law states that to compute E[g(X)], we don't need to first find the distribution of g(X). Instead, we can work directly with the original distribution of X.
Computation Formula
For a function g:R→R and random variable X, the expectation of g(X) is:
Monotonicity: If g(x)≤h(x) for all x, then E[g(X)]≤E[h(X)]
ProofLOTUS and monotonicity
In the discrete case, group values by y=g(x). Since P(g(X)=y)=∑x:g(x)=ypX(x), substitution in E[g(X)] and regrouping gives ∑xg(x)pX(x). Regrouping is valid for nonnegative terms or an absolutely convergent sum.
For a density, first take an indicator g=1B: both sides equal P(X∈B)=∫BfX. Linearity gives the claim for simple functions, finite linear combinations of indicators. Approximate a nonnegative measurable g increasingly by simple functions and apply monotone convergence; for integrable signed g, subtract positive and negative parts. This proof uses the monotone convergence theorem as an integration prerequisite, whose general proof is not yet in the calculus notes. The same argument works for joint distributions. Finally h−g≥0 implies E[h(X)]−E[g(X)]≥0, proving monotonicity whenever the difference is defined.
Application Examples
ExampleExpectation of Square Function
For any random variable X, computing E[X2]:
Discrete case: E[X2]=∑xx2⋅pX(x)
Continuous case: E[X2]=∫−∞∞x2⋅fX(x)dx
This result gives the standard variance formula: V(X)=E[X2]−(E[X])2
ExampleExpectation of Exponential Function
For any random variable X, computing E[etX]:
Discrete case: E[etX]=∑xetx⋅pX(x)
Continuous case: E[etX]=∫−∞∞etx⋅fX(x)dx
This is the definition of the moment generating function, which has wide applications in probability theory.
Numerical Estimation Methods
When functions are complex or distributions are non-standard, analytical solutions may be difficult to obtain. In such cases, we can use Taylor series approximation for numerical estimation.
Taylor Series Approximation Method
For a random variable X with mean μ and variance σ2, the expectation and variance of f(X) can be approximated using Taylor expansion.
ProofApproximation Derivation for Expectation
Perform second-order Taylor expansion of f(X) around μ:
Using E[X−μ]=0 and E[(X−μ)2]=σ2, and ignoring higher-order remainder terms:
E[f(X)]≈f(μ)+2f′′(μ)σ2
ProofApproximation Derivation for Variance
Use first-order Taylor expansion (usually sufficient for variance calculation):
f(X)≈f(μ)+f′(μ)(X−μ)
Since f(μ) is constant, it doesn't affect variance:
V[f(X)]≈V[f′(μ)(X−μ)]
Constant factors can be factored out:
V[f(X)]≈[f′(μ)]2V[X−μ]
Since V[X−μ]=V[X]=σ2:
V[f(X)]≈[f′(μ)]2σ2
Summary Formulas:
E[f(X)]V[f(X)]≈f(μ)+f′′(μ)2σ2≈(f′(μ))2σ2
Approximation Accuracy Notes
The expectation approximation uses second-order expansion, providing higher accuracy
The variance approximation uses first-order expansion; for strongly nonlinear functions, higher-order terms may be needed
When f(X) is a linear function, the approximation is exact
Approximation quality depends on the remainder bounds below.
A small variance alone does not control Taylor remainders. If ∣f(3)∣≤M on every segment between μ and a possible value of X, Taylor's remainder gives
E[f(X)]−f(μ)−21f′′(μ)σ2≤6ME∣X−μ∣3.
For the linear approximation write f(X)=f(μ)+L+R, with L=f′(μ)(X−μ). When the terms have finite second moments, covariance expansion and Cauchy–Schwarz give
∣Var(f(X))−Var(L)∣≤2Var(L)Var(R)+Var(R).
These bounds state the actual quantities that must be small; concentration without derivative and tail control does not guarantee accuracy.
Covariance and Correlation
When working with multiple random variables, we often want to measure their relationship.
Covariance
Cov(X,Y)=E[(X−μX)(Y−μY)]=E[XY]−E[X]E[Y]
Correlation Coefficient
ρX,Y=σXσYCov(X,Y)
Properties:
−1≤ρX,Y≤1
ρ=1: Perfect positive linear relationship
ρ=−1: Perfect negative linear relationship
ρ=0: No linear relationship (but may have non-linear relationship)
ProofCovariance and the correlation bound
Expanding centered products gives Cov(X,Y)=E[XY]−E[X]E[Y] and
Var(X+Y)=Var(X)+Var(Y)+2Cov(X,Y).
For U=X−E[X] and V=Y−E[Y], nonnegativity of E[(U−tV)2] at t=E[UV]/E[V2] gives E[UV]2≤E[U2]E[V2]. Thus ∣ρ∣≤1 when both variances are positive. Equality is equivalent to U=tV almost surely by the zero-variance argument. Positive t gives ρ=1, negative t gives ρ=−1. With a zero variance, correlation is undefined.
Independence gives zero covariance by the product formula. The converse fails: if X is uniform on {−1,0,1} and Y=X2, then E[X]=E[X3]=0, so covariance is zero, yet Y is determined by X and is not constant.
Common Distributions and Their Moments
Distribution
Expected Value
Variance
Bernoulli(p)
p
p(1−p)
Binomial(n,p)
np
np(1−p)
Poisson(λ)
λ
λ
Uniform(a,b)
2a+b
12(b−a)2
Normal(μ,σ²)
μ
σ2
Exponential(λ)
λ1
λ21
Important Theorems
TheoremLaw of Large Numbers
For i.i.d. random variables X1,X2,...,Xn with mean μ:
n1i=1∑nXiPμ as n→∞
This chapter uses the finite-variance version: an infinite i.i.d. sequence with E[Xi]=μ and Var(Xi)<∞. Its complete Chebyshev proof is given in the weak-law note. A finite first moment alone also suffices for the general i.i.d. weak law, but that requires a truncation argument beyond the displayed variance proof.
TheoremCentral Limit Theorem
For i.i.d. random variables with mean μ and variance σ2:
σn∑i=1nXi−nμDN(0,1) as n→∞
The assumptions here are an infinite i.i.d. sequence and 0<σ2<∞. For zero variance the displayed normalization is undefined. A proof via characteristic functions expands the standardized one-variable transform as 1−t2/2+o(t2), takes its n-th power at t/n to obtain e−t2/2, and then applies Lévy's continuity theorem. That last theorem and the expansion under a finite second moment are not established in this collection yet; this statement records a dependency for the planned probability-limit chapter, not a completed proof.
Expectation with Multiple Random Variables
When working with functions of multiple random variables, we need to understand how to compute their expectations.
Expectation of Functions of Multiple Variables
For a function g(X,Y) of two random variables, the expectation is computed using the joint distribution:
Zero-marginal points carry no mass and their conditional values may be chosen arbitrarily. Absolute integrability of Y justifies rearrangement. For a joint density replace sums by integrals and use fY∣X(y∣x)fX(x)=fX,Y(x,y) wherever fX(x)>0, followed by Fubini's theorem. This proves the displayed cases; the general measure-theoretic conditional expectation needs additional construction.
Exercises
ExerciseUniform Discrete Integer Sampling
An integer N is selected uniformly at random from {1,2,…,103}.
What is the probability that N is divisible by 3? By 5? By 7?
Compute the expected value E[N].
Compute the variance V(N).
Solution
Divisibility probabilities:
Divisible by 3: ⌊1000/3⌋=333 integers, so P(3∣N)=1000333=0.333.
Divisible by 5: ⌊1000/5⌋=200 integers, so P(5∣N)=1000200=0.200.
Divisible by 7: ⌊1000/7⌋=142 integers, so P(7∣N)=1000142=0.142.
Expected value:
For a uniform discrete random variable on {1,2,…,n} with n=1000:
E[N]=n1k=1∑nk=2nn(n+1)=2n+1=21001=500.5.
Variance:
Using the sum of squares formula ∑k=1nk2=6n(n+1)(2n+1):
Two coins are flipped independently. The first coin lands on heads with probability 0.6, and the second lands on heads with probability 0.7. Let X denote the total number of heads. Find E[X] and V(X).
Solution
Let X1∼Bernoulli(0.6) and X2∼Bernoulli(0.7) be indicator variables for the first and second coin landing heads. Then X=X1+X2.
One of the numbers {1,2,…,10} is chosen uniformly at random. You guess the number by asking yes-no questions of the form "Is the number strictly greater than k?" following an optimal binary search tree strategy. Compute the expected number of questions asked.
Solution
An optimal binary search strategy on 10 elements queries:
Query 1: "Is N>5?" (splits into {1..5} and {6..10}).
For {1..5}: query "Is N>2?" (splits into {1,2} and {3,4,5}).
For {6..10}: query "Is N>7?" (splits into {6,7} and {8,9,10}).
The depths in the decision tree:
Numbers resolved in 3 questions: 6 numbers.
Numbers resolved in 4 questions: 4 numbers.
Since all 10 outcomes are equally likely:
E[Questions]=106×3+4×4=1018+16=3.4.
ExerciseSt. Petersburg Game
A player tosses a fair coin repeatedly until a tail appears for the first time. If the first tail appears on the n-th flip, the player wins 2n dollars. Let X denote the player's winnings. Prove that E[X]=+∞.
Solution
The number of flips until the first tail follows a Geometric(1/2) distribution:
P(N=n)=(21)n−1⋅21=2n1,n∈{1,2,3,…}
When N=n, the winnings are X=2n. The expected payoff is:
E[X]=n=1∑∞2n⋅P(N=n)=n=1∑∞2n⋅2n1=n=1∑∞1=+∞.
ExerciseInspection Paradox on School Buses
Four buses carrying 148 students arrive at a school. The buses carry 40, 33, 25, and 50 students, respectively.
One student is selected uniformly at random from the 148 students. Let X denote the number of students on that selected student's bus.
One bus is selected uniformly at random from the 4 buses. Let Y denote the number of students on that selected bus.
Compute E[X] and E[Y], and explain the discrepancy.
Solution
Student perspective (X):
The probability that the chosen student is on a bus with i passengers is proportional to the bus size:
Bus perspective (Y):
Each bus is chosen with probability 41:
E[Y]=440+33+25+50=4148=37.0.
The difference E[X]>E[Y] is an instance of the inspection paradox: larger buses contain more students and are therefore more likely to be sampled when choosing a student at random. In fact, E[X]=E[Y]+E[Y]V(Y).
ExerciseVariance in the Bus Inspection Paradox
Compute the variances V(X) and V(Y) for the random variables X and Y defined in the preceding bus problem.
ExerciseProper Scoring Rule for Weather Forecasting
A weather forecaster announces a probability p∈[0,1] that it will rain tomorrow. The forecaster receives a score of 1−(1−p)2 if it rains, and 1−p2 if it does not rain. Suppose the forecaster's true internal belief is that it will rain with probability p∗. What probability p should the forecaster report to maximize their expected score?
Solution
The expected score as a function of the announced probability p is:
To find the maximum, take the derivative with respect to p:
dpdE[Score]=2p∗−2p.
Setting the derivative to zero yields p=p∗. The second derivative dp2d2E[Score]=−2<0 confirms this is a strict global maximum. Thus, the Brier scoring rule is strictly proper: the forecaster maximizes expected score if and only if reporting their honest probability p=p∗.
ExerciseQuotient Form and Independence of CDFs
Explain why the independence of random variables X1,X2,…,Xn cannot be formulated using a quotient ratio of CDFs:
Independence is defined by the product rule for joint probabilities: FX1,…,Xn(x1,…,xn)=∏i=1nFXi(xi).
A quotient of CDFs FX(x)FX,Y(x,y) does not correspond to the conditional CDF P(Y≤y∣X≤x) in general because conditioning on X≤x requires the joint probability P(X≤x,Y≤y) divided by P(X≤x), which is not FY(y) unless the variables are independent.
Moreover, writing the condition as a quotient requires assuming FX1(x1)>0, failing for all points outside the support. Independence is an intrinsic symmetry between unconditional distributions, correctly stated via products rather than ratios.
ExerciseMoments and Linear Combinations of Independent RVs
Let X and Y be independent discrete random variables with distributions:
Distribution of Z=2X+Y:
Possible values of 2X are {−2,0,2}. Values of Y are {0,2,4}.
The possible values of Z=2X+Y are {−2,0,2,4,6}.
Since X and Y are independent, P(X=x,Y=y)=P(X=x)P(Y=y):
Inductive Step: Assume the property holds for n=k, i.e. V(∑i=1kXi)=∑i=1kV(Xi).
For n=k+1, let Sk=∑i=1kXi. Since Xk+1 is independent of each X1,…,Xk, it is independent of their sum Sk. Applying the two-variable additivity rule:
Comments